Getting Started
Welcome to your property management platform. This guide will help you understand the main features and how to navigate the application.
Account Activation (Before Step 1)
You must activate your account before you can sign in.
- Open the invite email and click the invite link.
- New users: create a password and confirm it to activate your account.
- Existing users: click Accept Invitation to join the organization.
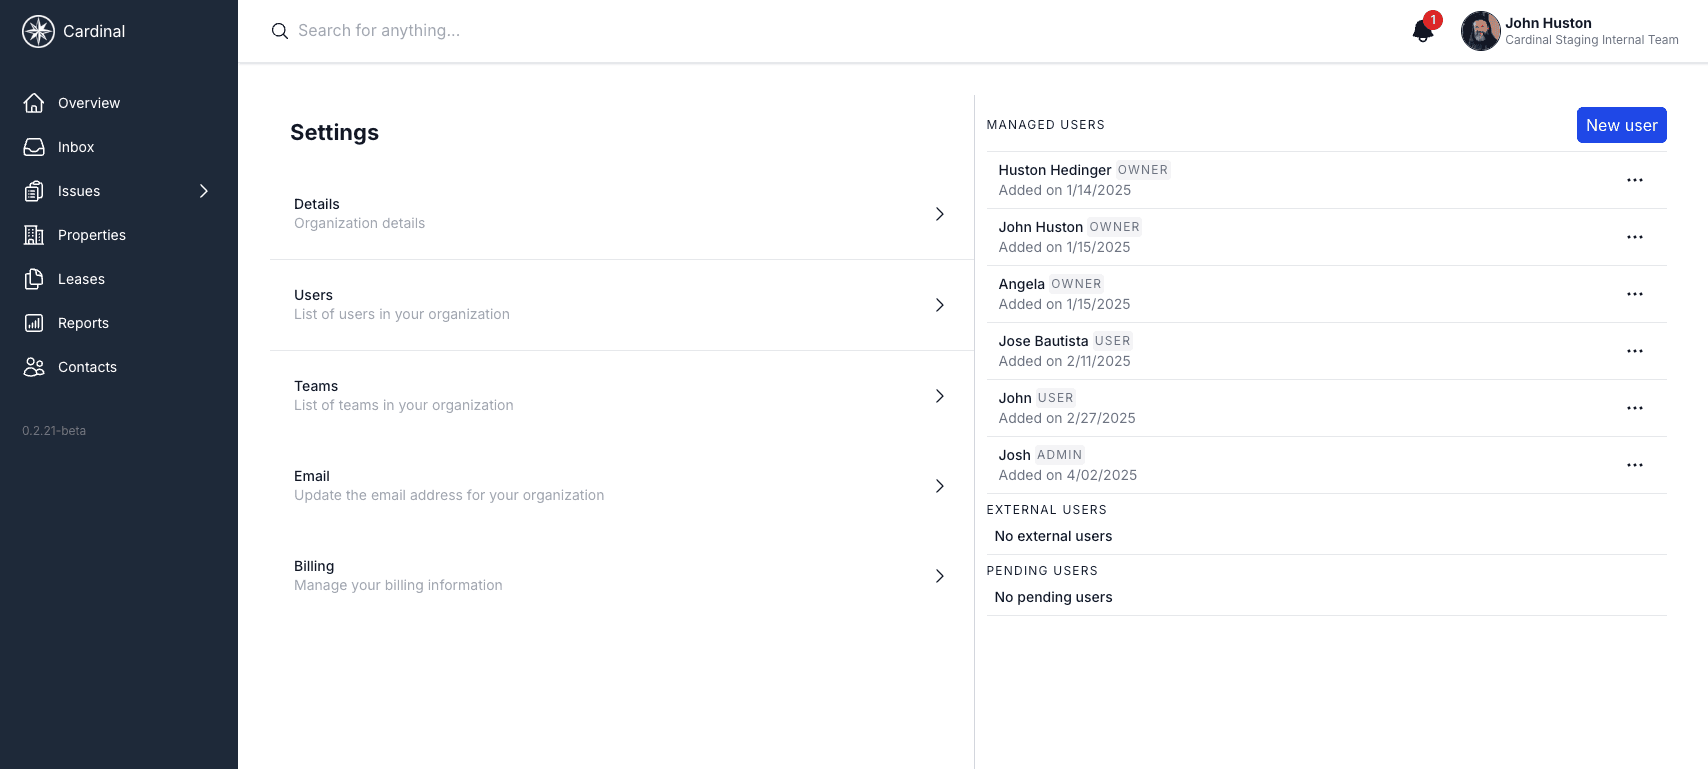
- If the link is expired, ask an admin to resend the invite from Settings > Organization > Users > Pending users.
After activation, sign in and you will land on the dashboard.
Welcome to Your Dashboard
The dashboard is the first page you'll see when you log in. It provides a comprehensive overview of your entire property portfolio's performance, with key metrics, charts, and upcoming items that require your attention.
New Organization Quick Start
Follow these four steps to get your organization fully operational.
Step 1: Add users
Go to Settings > Organization > Users, click New user, and enter their email, first name, and role. External users can only be assigned the User role.
Step 2: Add properties
Navigate to Properties and add your buildings, addresses, and property types.
View the Properties guide ->Step 3: Add leases
Go to Leases and create active tenant leases for each unit.
View the Leases guide ->Step 4: Add contacts
Use Contacts to add tenants, vendors, and companies you work with.
View the Contacts guide ->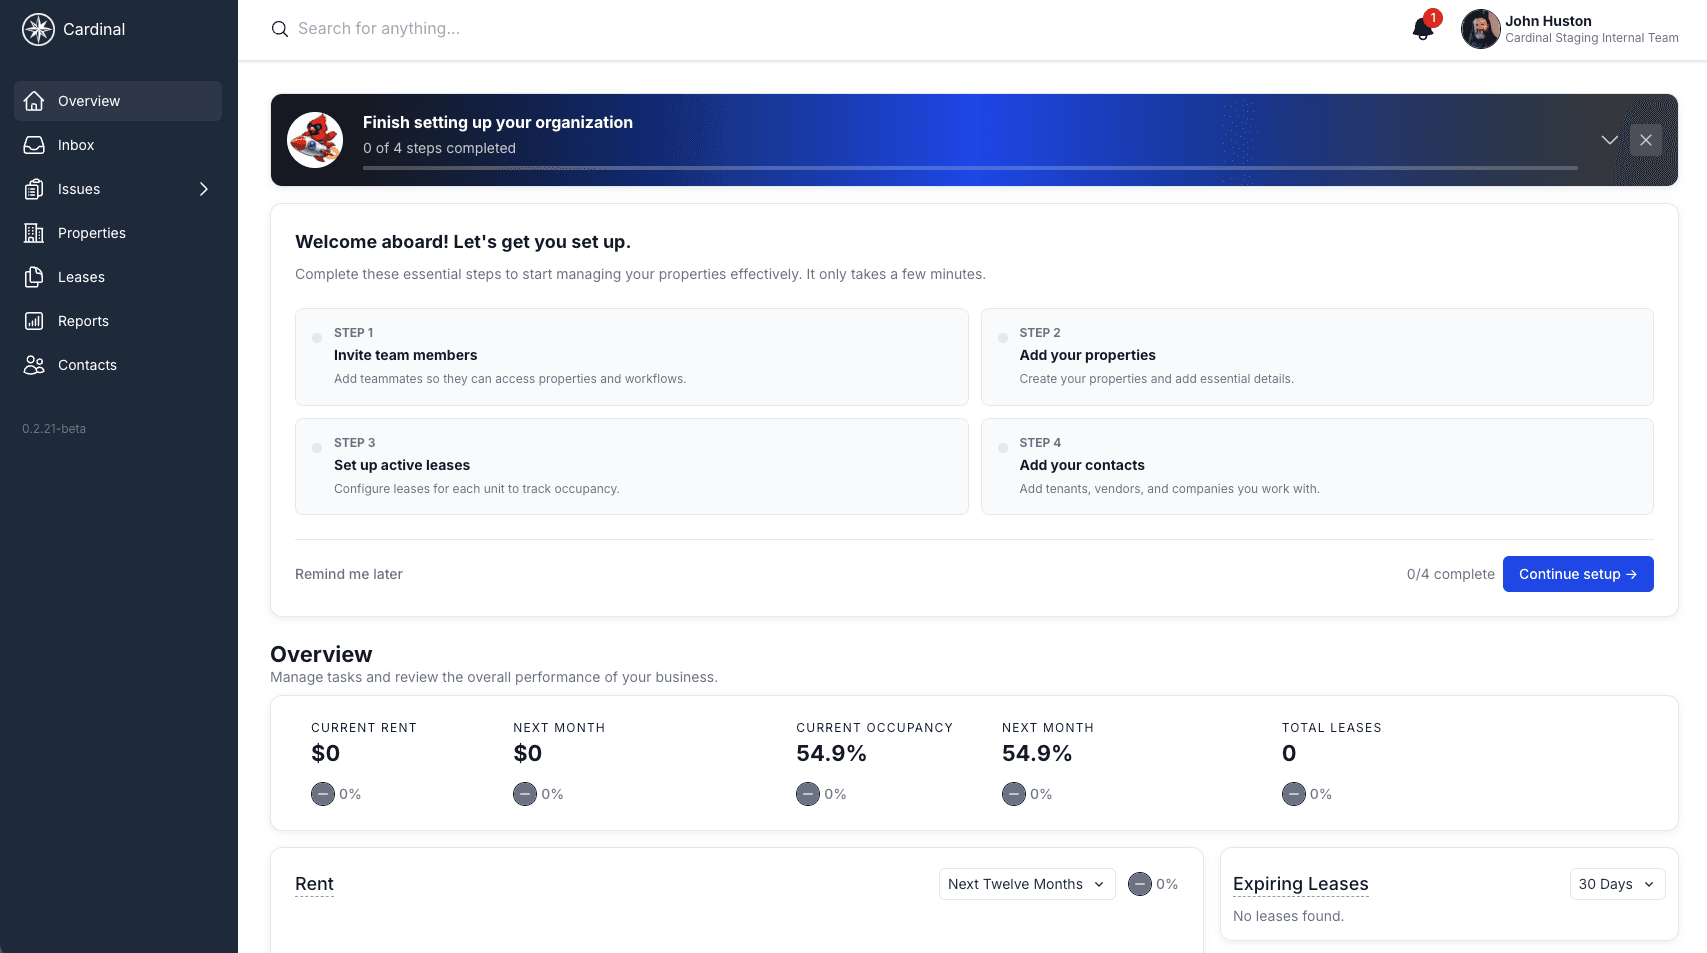
Key Metrics
The dashboard displays three critical metrics at the top of the page that give you instant insight into your portfolio's health:
Current Rent
Shows your total rental income for this month and next month, with month-over-month change indicators to track growth trends.
Occupancy Rate
Displays the percentage of your properties that are currently occupied, plus a projection for next month. This helps you identify vacancy trends and plan accordingly.
Total Leases
Shows the current number of active leases and month-over-month changes, helping you track tenant retention and turnover.
Charts & Analytics
Below the key metrics, you'll find interactive charts that help you visualize trends and make data-driven decisions:
Rent Chart
Visualizes your projected rental income over time. Use the date filters to adjust the timeframe (6, 12, or 18 months) to plan for future revenue and identify seasonal patterns.
Occupancy Chart
Shows occupancy percentage trends over your selected time period. This helps you spot potential issues with vacancy rates and plan leasing strategies.
Expiring Leases
A sidebar list of leases that are coming up for renewal. This allows you to proactively reach out to tenants and minimize vacancy gaps.
Navigating the Application
The left sidebar provides quick access to all major sections of the application. Click on any item to explore detailed documentation for that feature:
Inbox
Manage all communications with tenants, vendors, and team members. View messages, filter by property, and track conversation threads.
Issues
Track and manage maintenance requests and tasks using a Kanban-style board. Organize issues by status (Todo, In Progress, Completed) and assign them to team members.
Properties
Your central hub for managing all aspects of your real estate portfolio. View property details, units, tenants, documents, and maintenance history.
Leases
Manage tenant leases, track expiration dates, handle renewals, and maintain all lease-related documentation in one place.
Reports
Access detailed analytics including Rent Roll, Rent Projections, Occupancy Reports, Top Leases, and Lease Expiration Reports to make informed business decisions.
Contacts
Manage your directory of tenants, vendors, contractors, and team members. Store contact information and track interactions.
Quick Tips
Use the search bar at the top of the page to quickly find properties, tenants, leases, or issues across the entire platform.
Customize date ranges on the dashboard charts to view projections for different time periods and plan accordingly.
Check expiring leases regularly to stay ahead of renewals and maintain high occupancy rates.
Click on any metric in the dashboard to drill down into detailed reports and analytics.
Next Steps
Now that you understand the dashboard and navigation, explore the detailed guides for each section: